The Math of Numb3rs 101: Pilot
Background Reading material from Cornell University and some typos in it:
In:
"Since the sprinkler is stationary, however, the seeming randomness of the action of physics on each droplet will affect Charlie's model less and less as the number of droplets are observed."
Perhaps, the writer means:
as a number of droplets are observed
or (inclusive OR)
as a large number of droplets are observed
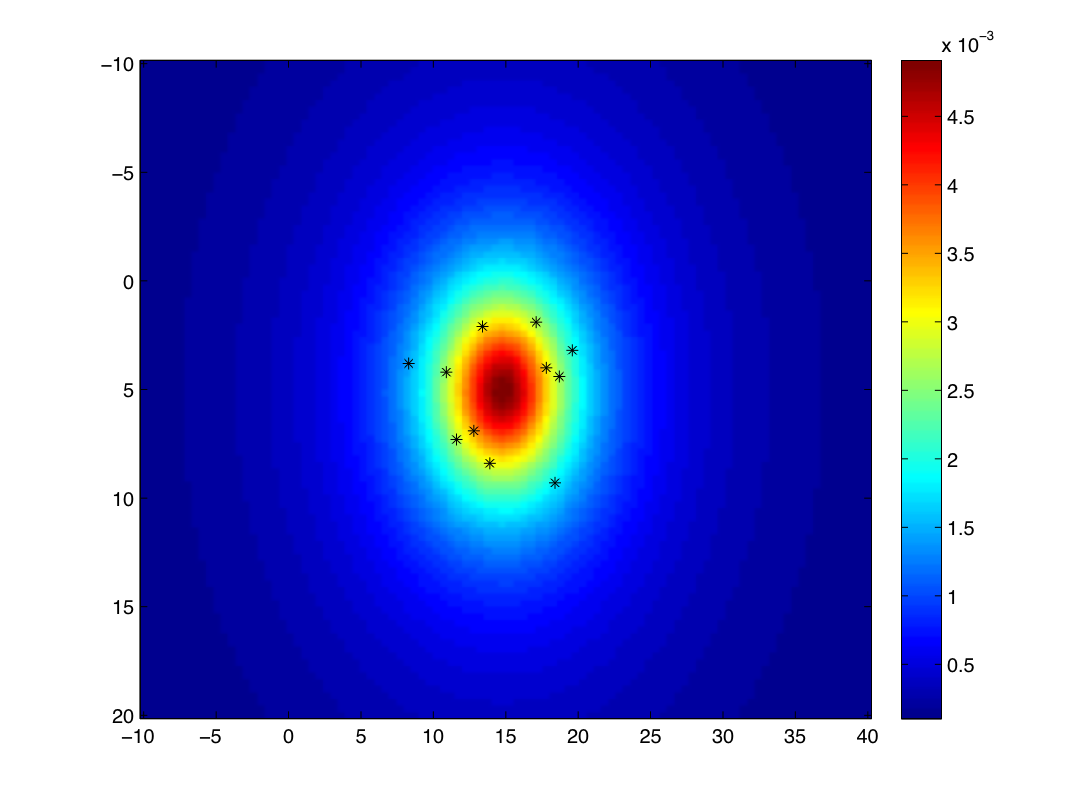
Carl Scarrott and Raaz Sainudiin have tried to reproduce Charlie's Heat Map (one hot zone without the outlier) in MATLAB using the method of Least Squares. See the MATLAB code used to reproduce Charlie's heat map with one zone by obtaining the data from screen shot of the map.
 |
PRIZES. If you present the maths/stats content in the reading material that interests you or address a challenge posted on any episode during our 10 minutes discussion session (1700-1710 hours) then you will get a ``special lunch package''!
CHALLENGES for numb3rs 101:
- Try reproducing any of the other heat maps using Least Squares from the data points available in the paused scenes from this episode. You can start by finding the x-y coorrdinates of the data points in the Boston and Oregon data as well a thorough updated data on Charlie's case (after the outlier's location has been corrected). All of these problems involve only one hotzone and you can modify the data matrix in MATLAB code script.
Try to regenerate the Heat Map from the source using Boston Data. You have to use a grid-laying software, such as Adobe Professional to obtain the data from the red points in the image below.
Heat Map from Source, the residence of the serial rapist in Boston, MA, USA, 1992 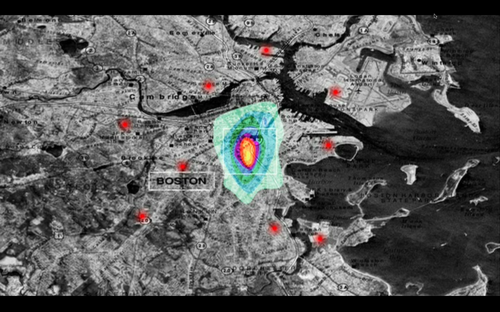
Try to regenerate the Heat Map from the source using Portland Data. You have to use a grid-laying software, such as Adobe Professional to obtain the data from the red points in the image below.
Heat Map from the source, residence of the the serial rapist in Portland, OR, USA, 1983 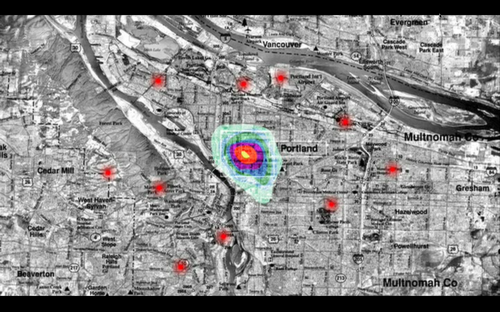
- Try to obtain two hot-zones from the data-points of thi victim-site locations in the current episodo from any combination of the next three images. Feel free to drop by my office if you get stuck.
Heat Map with two hot zones (murderer's residence and work): Idea inspired by two sprinklers.
Data and Idea for two hot zones inspired by two sprinklers. 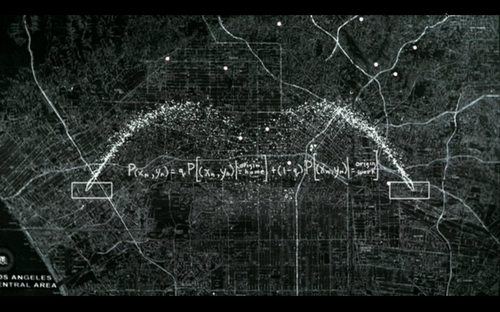
Victim-site data in the current episode to generate Heat Map with two hot zones (murderer's residence and work).
Two hot zone data in the current episode. 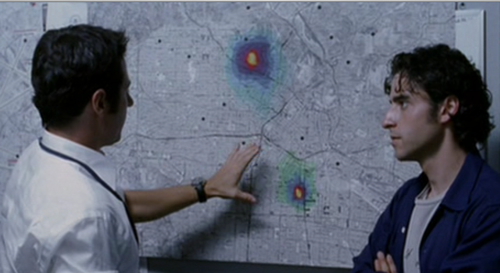
Close-up of Victim-site data in the current episode to generate Heat Map with two hot zones (residence and work). Note how the top border of the map is at a small negative acute angle with respect to the top border of the following image.
Close-up of Victim-site data in the current episode. 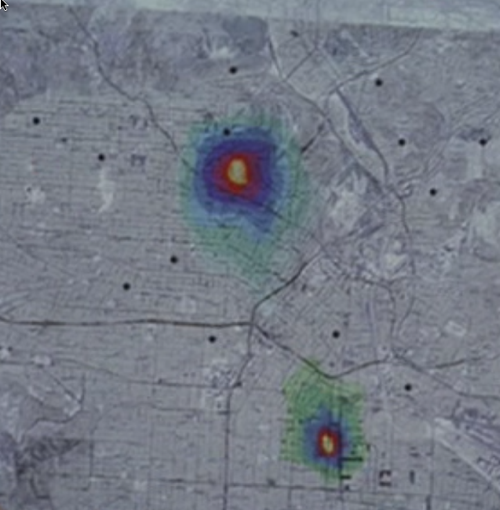
- Think of the simplest way to generate the confidence sets. How is Charlie assigning probabilities to the different contour-banded zones?
Maintained by Raazesh Sainudiin and mirrored by Paul Brouwers.
Last modified on Saturday, 03-Sep-2016 03:15:23 MST and served on Thursday, 25-Apr-2024 04:17:45 MST.